MaverickNH
NES Member
Good news for the anti-gunners - gun ownership is continually dropping - or not...
 www.rand.org

 www.thetrace.org

Gun Ownership in America
Information about how many Americans own guns, and how this varies over time and across the United States, is important for understanding the effects of gun laws on firearm ownership and other outcomes. Use this tool to explore the estimated household gun ownership rate by state from 1980 to 2016.
www.rand.org
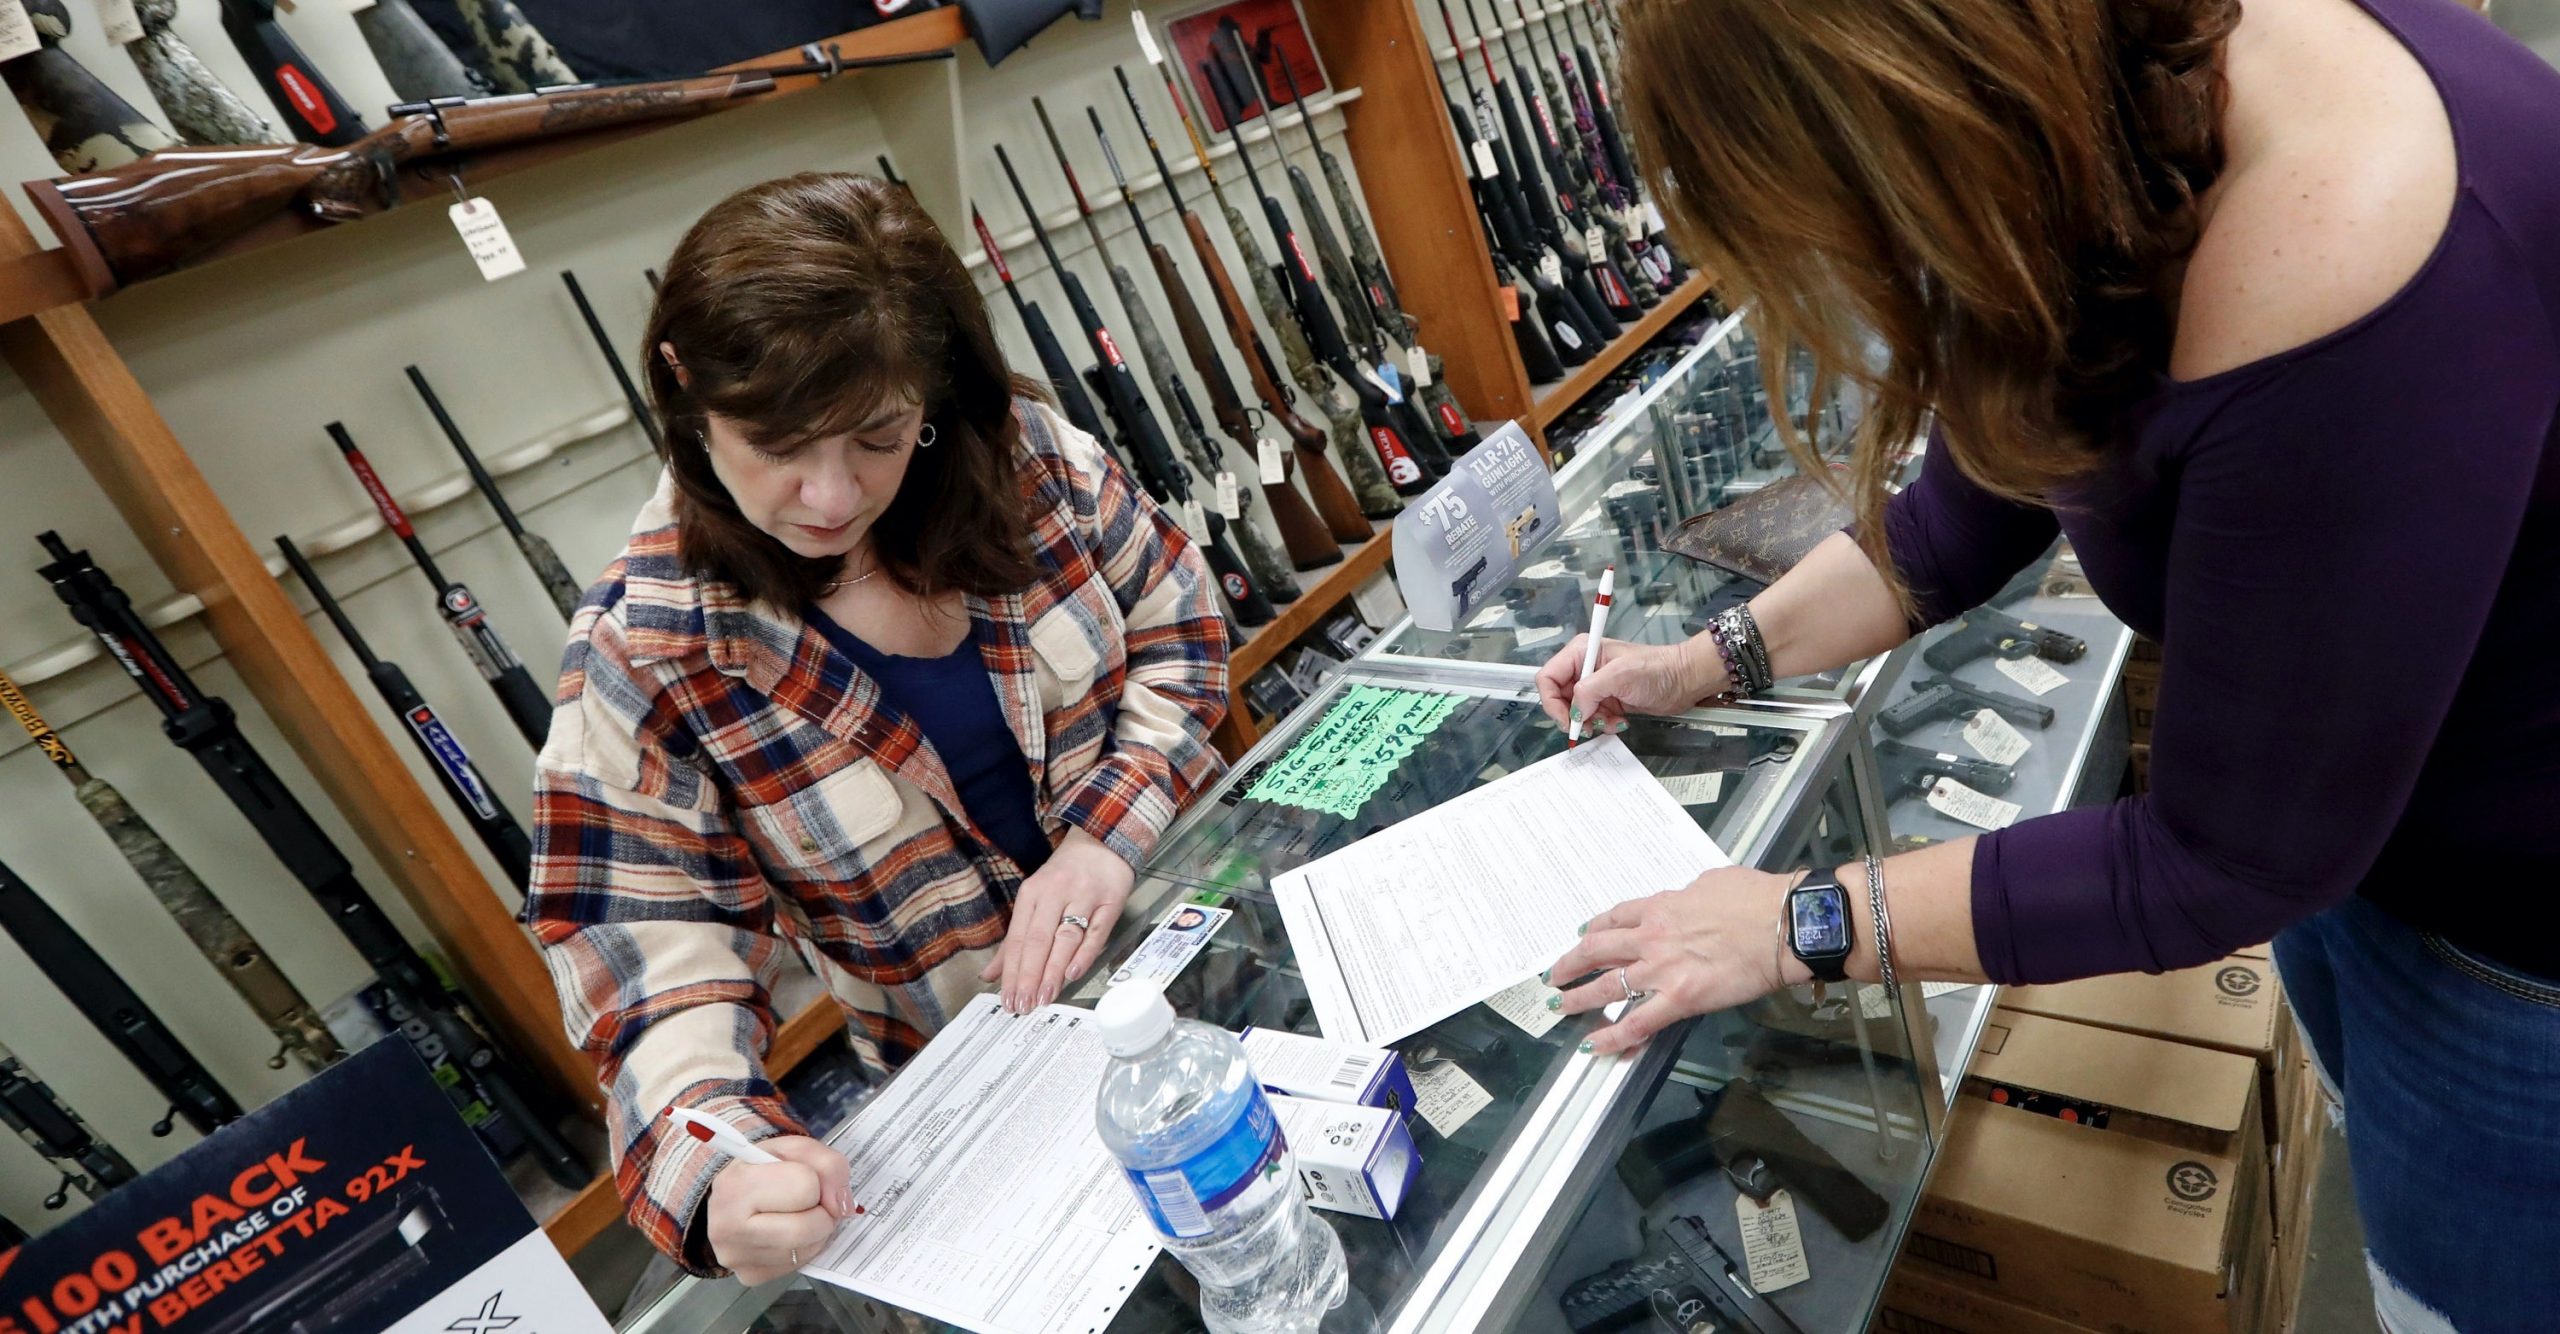
Gun Background Checks Reached New Record During Coronavirus Surge
The FBI processed 3.7 million screenings in March, topping the prior all-time high by 12 percent.
www.thetrace.org
![[bs]](/xen/styles/default/xenforo/smilies.vb/046.gif "BS [bs]")
![[bs2]](/xen/styles/default/xenforo/smilies.vb/047.gif "BS2 [bs2]") Plus, the freeking graph stops in 2015... Add it 2016 before the election and this year and you would see the huge rise that is actually happening.
Plus, the freeking graph stops in 2015... Add it 2016 before the election and this year and you would see the huge rise that is actually happening.